I am not a macro guy but it doesn't hurt to hear some really smart people talk about macro issues. Even Seth Klarman has become very macro sensitive in past year. These guys were very early in recognizing the credit crisis and I put lot of trust in their research work.
Worth a read
"Based on the initially published size of the QE2
program, we expect the Fed will struggle to increase
the rate of inflation. Persistently high unemployment,
uncertainty about government regulation and its scope,
and a limited appetite for capital investment mean the
Fed will have to shock markets to have inflation achieve
its desired outcomes. The Fed will potentially have to
buy more than expected for longer periods if it wants to
make the most important impact — a shift in
psychology. After more than thirty years in the U.S.
with the experience of negligible inflation, dramatic
actions are required to shift thinking of individuals and
markets."
For the full article
http://www.fpafunds.com/downloads/paramount/September%2030,%202010.pdf
Wednesday, December 8, 2010
Tuesday, November 30, 2010
Monday, November 29, 2010
Text to Speech app for IPOD/ITOUCH/IPAD
Since I am not getting enough time from work nowadays I have started using the text to speech app for catching up while I am driving. With this app I can hear the conference call transcripts, research reports from VIC, 10k/q`s on the drive as well as convert ebooks and news articles.
http://itunes.apple.com/us/app/speak-it-text-to-speech/id308629295?mt=8
Now I find myself adding more and more articles to the playlists so I highly recommend it to anyone who is having difficulty in finding time to sit at one place and read.
http://itunes.apple.com/us/app/speak-it-text-to-speech/id308629295?mt=8
Now I find myself adding more and more articles to the playlists so I highly recommend it to anyone who is having difficulty in finding time to sit at one place and read.
Friday, November 19, 2010
Wednesday, November 17, 2010
St Joe Short Interest
I recently bought JOE at around 20 bucks a share. The stock price is falling like a rock throughout the year. But things are getting interesting. I am not going to comment here about the underlying valuation of the company but just about the stock itself.
As of today(11/17/10) in millions
Total outstanding shares : 92
Total shares sold short : 21.6
Average daily volume : 2
Days to cover short at this volume : 18
Now this stock is liked by long term value oriented investors who I can speculate would not be selling the stock at these prices. Most likely they will be buying more. Lets find out who these people might be
1) Fairholme Fund : 27 (including holdings in privately managed funds besides Fairholme fund)
http://www.thestreet.com/story/10890674/1/berkowitz-to-einhorn-thank-you.html?cm_ven=GOOGLEN
2) THS Partners: 4.8 ( long term long only investors)
http://www.thspartners.com/philosophyprocess/process/
3) Third Avenue Management: 2.2 ( there is no way they will be selling)
4) Royce & Associates: 3.1 (Again a value investor that might not sell)
5) Janus Capital Management: 10.3 ( JOE is held in Janus Contrarian fund. I am not confident about them but since they are also value oriented fund I may speculate that they wont also sell at these prices)
Hence,
Total stocks not available in market for trading = 27+4.8+2.2+3.1+10.3 = 47.4
Assuming all of the above is true, 21.6/(92-47.4) = 48% of the float is sold short.
If the short interest rises further or if the stock price falls further it will be a good trade to buy some out of the money CALL options on this stock expiring in 6 months or so.
What do you think ?
I am not sure how many shares David Einhorn have shorted. If its a big position then IMO he should start covering soon.
As of today option expiring in Mar 18, 2011 to buy JOE at $17.5/share is selling for $1.7/contract
Saturday, October 30, 2010
Portfolio Update October,2010


Another very busy month for me and hence could not spend enough time researching stock ideas. Still I did find an opportunity to put some cash to work.
St. Joe (ticker: JOE) stock dropped due to a short thesis presented by David Einhorn. I also found out that T2 partners are also short St. Joe. On the other hand Bruce Berkowitz(FAIRX) at fairholme capital and Michael Winer(TAREX) at Third Avenue have been bullish about its long term potential and have JOE in their portfolio as a long term holding.
Since I have followed all of the above investors for quite some time I know their respective investment styles.Both T2 and Greenlight are long/short funds and they do trade in and out of their positions quickly to take profits or if a better idea shows up or if their thesis is wrong. While both Bruce and Michael tend to make long term bets and are willing to wait for the investment thesis to work out. So to agree with the short or long thesis on JOE you need to know your own investment time horizon.
I personally like to make very few bets and feel guilty if I am doing lot of trading. My favorite stock would be the one which I never have to sell(besides for tax reasons). So I don't mind if St. JOE is dead money for sometime since I do have ample cash in the portfolio to invest. I don't know much about true value of St. Joe and this purchase is a pure call based on my trust in the fund managers that own it. If in future they trim their position that would be a red flag and I may sell out of this position also.
Saturday, October 16, 2010
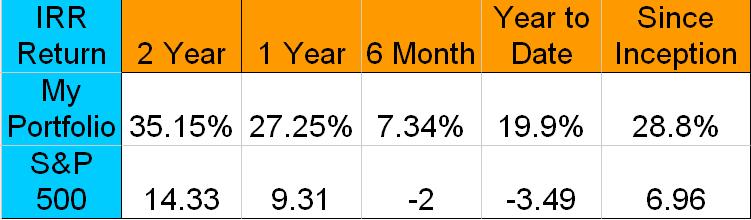
Total Return vs IRR
As you might know I use IRR to state my portfolio returns. But it is a bit misleading. For example on September 30th of 2010 my IRR return stood at +19.9% YTD vs -3.49% for the S&P 500 index. But if you check any other website you will see that S&P 500 returned +2.34% during that time frame.
The difference arises from the fact that IRR takes into account the cash flow decisions you make i.e. buying and selling of stocks during the time frame as well as penalizes you for holding cash.
Even though the IRR makes it difficult to compare my returns with other portfolio returns I believe its a better metric for me to judge my performance. This method not just gives weight to my stock selections but timing of purchase and sale.
Following is a discussion of various ways to measure returns from Morningstar.com


 On a more technical note, the true definition of the Personal return is the discount rate that equates the cost of an investment with the value of the cash generated by that investment period. So, by setting the above equation to 0 the result will provide the value for “r”, which represents the discount rate that will provide a net present value cash flow equal to zero.

Saturday, October 9, 2010
Thursday, September 30, 2010
Portfolio Update September,2010


September was yet another boring month. Only activity in my portfolio was to sell BBEP at beginning of the month. I have been very busy at work and have hardly got time to look into more investment ideas. As you can see with over 50% of portfolio in cash I need to find good investments. But having a lot of cash is a good problem so long as you have the perseverance to wait for the right opportunity.
I wrote my opinion on BBEP`s valuation before here. The DCF value of the stock is between 16 and 21. But DCF does not take into account the leverage required to achieve the cash flows. At EV/FCF of 10 it certainly wasn't cheap. The positives that might drive the stock higher is relatively low inflation and demand for high dividend paying investments. The negatives that might tank the stock maybe high interest rates(has $552M of floating rate debt) without natural gas prices shooting up because of excess supply. Also there is an overhang of california increasing taxes on the oil production which would screw low margin producers like BBEP. BBEP has 10% of its production from california. Also the CEO sold 30k shares at 17.2 on August 23.I sold my entire position at 17.39. I might have sold too early but I was happy with the price I got for my shares. Here is my history of buys and sells with BBEP stock.

Wednesday, September 29, 2010
Value Investing in India
http://www.morningstar.com/cover/videocenter.aspx?id=336034
"India has the second largest number of listed companies in the world. There are lots of small companies that probably should not have been listed, that are listed. That gives an opportunity for people to find things when others aren't looking there."
SimoleonSense.com interviews Chetan Parikh
http://www.simoleonsense.com/wp-content/uploads/2009/11/miguel-barbosa-of-simoleonsense-interviews-prominent-indian-value-investor-chetan-parikh.pdf
I particularly like Chetan Parikhs comment on investor bias
" 1) self-serving bias (i.e. an overly positive view of their own abilities and an overly over-optimistic view of the future) 2) self-deception and denial for they seem to have indulged in collective wishful thinking 3) bias from consistency tendency (they must have looked for evidence that confirmed their optimistic beliefs and kept on being consistent to their original ideas even when problems surfaced) leading to 4) status quo bias or the do-nothing syndrome 5) impatience in valuing the present more highly than the future again caused by incentives that made them so myopic 6) bias from envy from managers who were making large returns with apparently no extra risk which led to 7) distortion by contrast comparison because the steady escalation of commitments must have seemed incrementally small
caused by 8) anchoring to what seemed like small relative numbers 9) social proof which
led to imitating the behavior of their peers 10) bias from over-influence by authority in
that the CEOs of the banks that have suffered the most seem to have been run by people
who did not have a ‘trading’ or ‘market’ background and they were swayed by the
‘experts’ they were overseeing which led them to 11) sensemaking in that they were too
quick to draw conclusions and may have become 12) reason-respecting in that they
complied with requests from their subordinates merely because they had been given some
reason leading to 13) a do-something syndrome all caused by 14) mental confusion from
stress. "
Tuesday, September 28, 2010
David Tepper Interview
“In 1898, the first international urban-planning conference convened in New York,” he said. “It was abandoned after three days because none of the delegates could see any solution to the growing crisis caused by urban horses and their output. In the Times of London, one reporter estimated that in 50 years, every street in London would be buried under nine feet of manure.”
" Don’t listen to all the crap out there.”
http://nymag.com/news/features/establishments/68513/
" Don’t listen to all the crap out there.”
http://nymag.com/news/features/establishments/68513/
Monday, September 27, 2010
Charlie Munger speech at Univ of Michigan
This post comes a little too late. I never miss a chance to hear Charlie Munger speak. So like a enthusiastic kid I heard the entire two hour talk which was available here
http://rossmedia.bus.umich.edu/rossmedia/SilverlightPlayer/Default.aspx?peid=4d215177cbe44b1e8e94d0dd68f5058f
But now the link seems to be dead. But if you missed it you can get a summary here
http://finance.yahoo.com/news/Charlie-Munger-on-Communism-fool-1939650256.html
http://rossmedia.bus.umich.edu/rossmedia/SilverlightPlayer/Default.aspx?peid=4d215177cbe44b1e8e94d0dd68f5058f
But now the link seems to be dead. But if you missed it you can get a summary here
http://finance.yahoo.com/news/Charlie-Munger-on-Communism-fool-1939650256.html
Saturday, September 25, 2010
Pabrai Interview
This is pretty old but still worth a read if you haven't already
http://www.dnaindia.com/money/interview_we-will-never-see-another-warren-buffett_1301088-all
http://www.dnaindia.com/money/interview_we-will-never-see-another-warren-buffett_1301088-all
Friday, September 17, 2010
Income disparity in US
WSJ has a interesting article .....read here
http://s.wsj.net/public/resources/documents/US-Income-and-Poverty-in-2009.html

Obama should show this chart to people who oppose the expiration of bush era tax cuts for the top 2% earners.
http://s.wsj.net/public/resources/documents/US-Income-and-Poverty-in-2009.html

Obama should show this chart to people who oppose the expiration of bush era tax cuts for the top 2% earners.
Saturday, September 11, 2010
Third Avenue Quarterly Letter
http://www.thirdavenuefunds.com/ta/documents/sl/TAF%203Q%20Shareholder%20Letters.pdf
Third Avenue`s fund managers quarterly and annual letters are always fun to read. Unlike other MF letters they do not talk about portfolio average performance vs benchmarks or what is their view of the stock market. They talk about individual stocks they purchased during the quarter and give a detailed overview of their investment methodology. I particularly liked the overview of POSCO by Ian Lapey and I believe this stock is worth further investigation.I think Warren Buffett also owned/bought POSCO few years ago but I maybe wrong. Since cash makes up around 55% of my portfolio I am excited to see how Michael Winer is using his cash hoard.He is selling out of the money PUT options on stocks he is willing to buy. In volatile times like these selling PUT options can be a good source for generating incremental earnings.
Third Avenue`s fund managers quarterly and annual letters are always fun to read. Unlike other MF letters they do not talk about portfolio average performance vs benchmarks or what is their view of the stock market. They talk about individual stocks they purchased during the quarter and give a detailed overview of their investment methodology. I particularly liked the overview of POSCO by Ian Lapey and I believe this stock is worth further investigation.I think Warren Buffett also owned/bought POSCO few years ago but I maybe wrong. Since cash makes up around 55% of my portfolio I am excited to see how Michael Winer is using his cash hoard.He is selling out of the money PUT options on stocks he is willing to buy. In volatile times like these selling PUT options can be a good source for generating incremental earnings.
Wednesday, September 8, 2010
Sequoia fund investor day Q&A transript
I know this is a long read but in my opinion its the best article on business insight I have read this year. Highly recommend it.
http://www.sequoiafund.com/reports/transcript10.htm
http://www.sequoiafund.com/reports/transcript10.htm
Question:
I'd like to know your thoughts on gold and energy. I'm looking at the portfolio of some other value managers out in L.A. here and I see that their allocation to energy is about 38 percent and yours is pretty much zero. I'm curious to know what you guys think.
Chase Sheridan:
Generally speaking I would agree with Buffett's comments about gold. You take the yellow metal out of the ground and then you put it to industrial uses or jewelry and then often you put it back into the ground. So it becomes a sentiment bet. You are making a macro bet on the level of worldwide confidence in fiat currency.
To me it just doesn't make any sense. You don't get a yield. If you are really worried about inflation risk, there are ways to hedge inflation risk where you still get a reasonable yield. You might look at timber, you might look at oil companies. But one very good way I think to hedge inflation risk is to invest in excellent companies that have pricing power. You get yield from that; so I don't really see a reason to buy gold when you can invest in a business that leverages the creativity of people and gives you an earnings yield at the same time.
Bob Goldfarb:
I'd add that I think the people who are buying the gold are making a macro bet and they may well be right. But we haven't done that well making macro bets; so we probably are going to stay away from it.
Greg Alexander:
On energy I'd give the same answer I gave a few years ago. Which is it's a good business; we spend time on it. At least three or four people here have written internal reports on energy companies within the last six months. There are some wonderful companies. We own a few shares of Canadian National Resources, which is a very smart company run out of Canada by Murray Edwards. But in general we don't know what the price is going to be of oil and gas. So sort of like with gold, we just don't know what the price will be, we don't really know how to forecast it. So there tend to be people who have firmer opinions than we do about what the price of oil and gas will be. Therefore, they end up being willing to pay more for the shares than we are.
There is a good saying in the oil and gas business that the cure for high prices is high prices, and the cure for low prices is low prices. So for example at the moment no one is interested in gas because the price is so low. But the fact is the gas supply goes down 25 percent in one year in the United States if there is no drilling. So if people would just stop drilling, any supply and demand problem that you could think of would be quickly corrected.
Bob Goldfarb:
One thing I'd add is that some of the oil price is driven by speculators rather than by natural demand of energy users. I'm just more comfortable with a price of a commodity that is set by market forces and doesn't have that speculative component that both oil and gold have.
Tuesday, August 31, 2010
Portfolio Update August,2010


In my 401k account I moved all of the money from ITRIX to VIFSX. I have held ITRIX(T. Rowe Price Capital Appreciation) since January 2009. It is a balanced mutual fund with value oriented managers. The reason for selling it was that it has 25% of its assets in treasuries and bonds. In my opinion both are overvalued presently. I bought VIFSX more out of dislike for other MF`s than liking for VIFSX. Its a low cost index fund tracking S&P 500. Besides that I did a round trip trade in Amedisys stock which I have explained in one of the write ups before.
Basically it was a pretty uneventful month.
Friday, August 20, 2010
Klarman's Perseverance
Normally people know Seth Klarman as the genius who averaged over 20% per annum since 1983 while S&P 500 over the same period averaged only 7%. The difference between those two returns is that if you invested 1000$ with Seth Klarman in 1983 it would have become $137000 today while the same amount would be $6200 today if invested in S&P 500.perseverance
–noun
1.
steady persistence in a course of action, a purpose, a state,etc., esp. in spite of difficulties, obstacles, or discouragement.
But one quality of Seth Klarman that gets under emphasized is his perseverance. Lets look at the following table

During the tech bubble of late 90's tech stocks valuations were sky high. Due to the lack of finding good values Klarman kept around 25% in cash, 30% in special situations, 10% in bond and only 35% in stocks. He also hedge the stock market exposure by buying PUT options. Every year from 1995 to 2000 he underperformed the index and also lost money on the PUT options that would expire worthless at end of the year. But consistently he held onto the cash as well as kept buying PUT options every year.
As we all know well S&P 500 index fell 43% after 2000 and 10 years later is still 30% lower than its peak set in 2000.
He wrote this to his investors in 1999
Thus for long term success in investing you need not just the right technique but the right temperament."We underperformed in 1999 not because we abandoned our strict investment criteria but because we adhered to them, not because we ignored fundamental analysis but because we practiced it, not because we shunned value but because we sought it, and not because we speculated but because we refused to do so. In sum,and very ironically, we got hurt not speculating in the U.S. stock market."
In Buffett's words
"Success in investing doesn't correlate with I.Q. once you're above the level of 125. Once you have ordinary intelligence, what you need is the temperament to control the urges that get other people into trouble in investing."
Thinking of buying Put options on TLT
Put option is basically an investment that increases in value as the underlying security decrease in price. If the underlying security increases in price or stays constant your worst case loss is the money you paid to buy the option.
Each option has an exercise price and exercise date. European style put options can only be liquidated based on the price on the date of expiry of the option.American put options can be traded all the time.Because of the exercise date there is a decay in value of the option as the exercise date comes closer.Hence with an option,unlike stock, you not only have to be right about the stock price but also the timing when the stock reaches such price.
Recently Seth Klarman gave a speech that can be read here
http://valuestockplus.net/2010/05/20/seth-klarman-notes-from-cfa-institute-speech/
http://www.google.com/finance?q=tlt
Shorting this bond means I am expecting inflation and long term interest rates to go up. To keep the risk of time decay to minimum possible I am thinking of buying the longest dated option available.....which currently is Jan 20,2012.
As of today(August 20th,2010) a Put Option with exercise price of $80 is available for $2.6. As each option contract comes in multiples of 100 the minimum money you have to lay out to buy such an option would be 1*2.6*100 = 260$. Here is how the returns will play out based on the interest rate movements


Hence this is a high risk high return bet. So I would put a small % of my portfolio in this position. But the advantage of this strategy is that if your bet does not materialize the downside is basically what you paid for the option but the upside is tremendous.
Another very important thing to keep in mind is that lot of people have made this trade since 2008 and none of their dire predictions have worked out.Timing is extremely important in this trade.Who knows 2 years from now this option might expire worthless with LTI rates still at sub 3%.
Each option has an exercise price and exercise date. European style put options can only be liquidated based on the price on the date of expiry of the option.American put options can be traded all the time.Because of the exercise date there is a decay in value of the option as the exercise date comes closer.Hence with an option,unlike stock, you not only have to be right about the stock price but also the timing when the stock reaches such price.
Recently Seth Klarman gave a speech that can be read here
http://valuestockplus.net/2010/05/20/seth-klarman-notes-from-cfa-institute-speech/
Klarman is seeking an inexpensive hedge against dollar destruction as he is trying to protect against catastrophic tail risk. His way to hedge against inflation is through way out of the money puts on bonds. If interest rates go to double-digit ranges, he will make a lot of money. As long as the insurance is cheap enough, he will do it.To hedge against inflation I have been thinking of buying out of the money PUT options on TLT(20+ year treasury bond).
http://www.google.com/finance?q=tlt
Shorting this bond means I am expecting inflation and long term interest rates to go up. To keep the risk of time decay to minimum possible I am thinking of buying the longest dated option available.....which currently is Jan 20,2012.
As of today(August 20th,2010) a Put Option with exercise price of $80 is available for $2.6. As each option contract comes in multiples of 100 the minimum money you have to lay out to buy such an option would be 1*2.6*100 = 260$. Here is how the returns will play out based on the interest rate movements

TLT Price vs Long Term Interest Rate

Return in % vs Long Term Interest Rates
Hence this is a high risk high return bet. So I would put a small % of my portfolio in this position. But the advantage of this strategy is that if your bet does not materialize the downside is basically what you paid for the option but the upside is tremendous.
Another very important thing to keep in mind is that lot of people have made this trade since 2008 and none of their dire predictions have worked out.Timing is extremely important in this trade.Who knows 2 years from now this option might expire worthless with LTI rates still at sub 3%.
Wednesday, August 18, 2010
Breitburn Energy Partners (BBEP)
Recommendation : I would sell BBEP at around 18-19 if I find other more attractive stocks.
Breitburn Energy Partner is a Master Limited Partnership(MLP) which is in oil and natural gas production business. It buys or leases land or wells with proved Oil and Gas reserve with minimal exploration risk. Also it is structured as an MLP and hence has to distribute all its free cash flow(money that remains after all the operating expenditure) to its shareholders.
This company is my largest holding accounting 18% of my portfolio. Since the price has run up lately I wanted to revisit the valuation and see if its still worth holding at current price.Following is my attempt to use Discounted Cash Flow model(DCF) to value the stock of this MLP

I have assumed a hedged price per BOE of 58$ and unhedged price per BOE as 47.5(current prices).Also I have assumed a 8% discount rate above. In DCF the most tricky part usually is to choose the right discount rate. A wrong choice of discount rate could give a totally different valuation.
For example in case of BBEP
discount rate 7% gives a value of 21.14 per share.
discount rate 8% gives a value of 19.14 per share.
I believe the choice of discount rate should be based on two criteria
In the above model I have also not assumed anything about natural gas and oil prices. Their future values would significantly impact the present value of the stock.Generally MLP stocks are held by investors for dividend income and hence valued based on dividend yield. I do not believe in such narrow minded view. A company should be valued based on present value of its free cash flow it would generate. It does not make a difference if that cash flow is paid out to me as dividend or stays with the company for future investment as long as the management generates more than a dollar for every one dollar invested.
Personally I would sell BBEP at around 18-19 if I find other more attractive stocks.
References:
http://sec.gov/Archives/edgar/data/1357371/000114420410012812/v176868_10k.htm
http://sec.gov/Archives/edgar/data/1357371/000135737110000009/file_10q.htm
Breitburn Energy Partner is a Master Limited Partnership(MLP) which is in oil and natural gas production business. It buys or leases land or wells with proved Oil and Gas reserve with minimal exploration risk. Also it is structured as an MLP and hence has to distribute all its free cash flow(money that remains after all the operating expenditure) to its shareholders.
This company is my largest holding accounting 18% of my portfolio. Since the price has run up lately I wanted to revisit the valuation and see if its still worth holding at current price.Following is my attempt to use Discounted Cash Flow model(DCF) to value the stock of this MLP

I have assumed a hedged price per BOE of 58$ and unhedged price per BOE as 47.5(current prices).Also I have assumed a 8% discount rate above. In DCF the most tricky part usually is to choose the right discount rate. A wrong choice of discount rate could give a totally different valuation.
For example in case of BBEP
discount rate 7% gives a value of 21.14 per share.
discount rate 8% gives a value of 19.14 per share.
discount rate 9% gives a value of 17.35 per share.
discount rate10% gives a value of 15.74 per share.
I believe the choice of discount rate should be based on two criteria
- What is the current no risk investment yield ? In my case its less than 1% in the bank account.
- What opportunities are out there,given all other variables being equal, which are even more cheaper when compared at the same discount rate.
Recently Wells Fargo said this about BBEP
"We are upgrading our rating on BBEP on the heels of a number of positive developments occurring within the partnership. Specifically, distribution growth is poised to accelerate to a subsector leading 7-8% annual rate for 2011 and 2012 (versus 2-3% for the upstream MLP peer group), production is trending towards the high end of guidance, management is back to pursuing acquisitions, and option value tied to BBEP’s prospective Collingwood-Utica acreage in Michigan is steadily gaining visibility."So it seems like they are using a discount rate between 7.5 and 8.5.
In the above model I have also not assumed anything about natural gas and oil prices. Their future values would significantly impact the present value of the stock.Generally MLP stocks are held by investors for dividend income and hence valued based on dividend yield. I do not believe in such narrow minded view. A company should be valued based on present value of its free cash flow it would generate. It does not make a difference if that cash flow is paid out to me as dividend or stays with the company for future investment as long as the management generates more than a dollar for every one dollar invested.
Personally I would sell BBEP at around 18-19 if I find other more attractive stocks.
References:
http://sec.gov/Archives/edgar/data/1357371/000114420410012812/v176868_10k.htm
http://sec.gov/Archives/edgar/data/1357371/000135737110000009/file_10q.htm
Subscribe to:
Posts (Atom)